
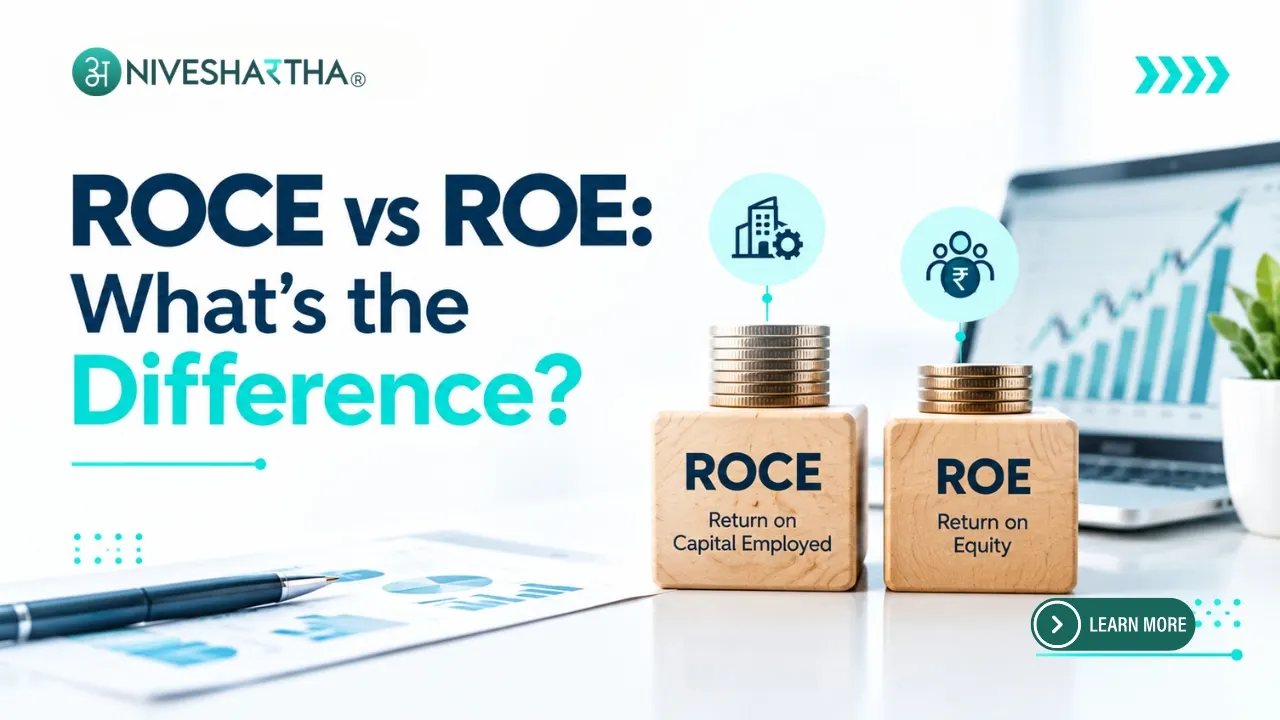
When evaluating a company, investors often look beyond revenue and profit to understand how efficiently a business uses the capital available to it. Two important profitability ratios that can help with this analysis are ROCE (Return on Capital Employed) and ROE (Return on Equity).
Although both ratios measure returns, they answer different questions. Understanding the difference can help investors develop a more complete view of a company's financial performance.
What Is ROCE?
ROCE, or Return on Capital Employed, measures how efficiently a company generates operating profits from the total capital employed in its business.
A commonly used formula is:
ROCE = EBIT ÷ Capital Employed × 100
Where:
- EBIT = Earnings Before Interest and Tax
- Capital Employed = Total Assets − Current Liabilities
ROCE is particularly useful when comparing companies that require significant capital to operate, such as manufacturing, infrastructure, engineering, and other asset-intensive businesses.
What Does a Higher ROCE Indicate?
A consistently higher ROCE can indicate that a company is generating stronger operating returns relative to the capital invested in its business.
However, ROCE should not be viewed in isolation. Investors should consider the company's industry, historical performance, and how its ROCE compares with peers.
What Is ROE?
ROE, or Return on Equity, measures how effectively a company generates profit using the shareholders' equity invested in the business.
The basic formula is:
ROE = Net Profit ÷ Average Shareholders' Equity × 100
For example, if a company generates ₹20 crore in net profit from ₹100 crore of shareholders' equity, its ROE would be 20%.
ROE is particularly useful for understanding the return generated on shareholders' capital.
ROCE vs ROE: The Key Difference
The easiest way to understand the difference is:
| ROCE | ROE |
|---|---|
| Measures return on capital employed | Measures return on shareholders' equity |
| Uses operating profit (EBIT) | Uses net profit |
| Looks at the efficiency of the overall capital employed | Focuses on shareholders' capital |
| Useful for assessing operating efficiency | Useful for assessing shareholder returns |
| More relevant when studying capital-intensive businesses | Widely used across different types of companies |
A Simple Example
Imagine a company has:
- Capital employed: ₹200 crore
- EBIT: ₹30 crore
- Shareholders' equity: ₹100 crore
- Net profit: ₹20 crore
Its:
ROCE = 30 ÷ 200 × 100 = 15%
ROE = 20 ÷ 100 × 100 = 20%
Both ratios provide useful information, but they are measuring different aspects of the business.
Why Can ROE Be Higher Than ROCE?
One important reason is financial leverage.
A company that uses debt to finance its operations may generate a higher return on shareholders' equity when the business performs well. However, greater leverage also introduces additional financial obligations and risk.
This is why a high ROE should not automatically be interpreted as evidence of a superior business.
Investors can look at ROE alongside ROCE, debt levels, interest coverage, cash flows, and profitability trends to understand the bigger picture.
Should Investors Look at ROCE or ROE?
The answer is: both can be useful.
ROCE can provide insight into how efficiently the business uses the capital employed in its operations, while ROE helps investors understand the return generated on shareholders' equity.
Instead of focusing on a single year's ratio, investors may find it more useful to examine:
- The company's ROCE and ROE trend over several years
- Comparison with industry peers
- Debt levels
- Profit margins
- Cash flow generation
- Changes in capital employed
- Sustainability of the company's earnings
A company with consistently strong returns, manageable debt, healthy cash generation, and stable operating performance may present a different fundamental picture from a company where high returns are largely supported by increasing leverage.
ROCE vs ROE: The Bigger Picture
ROCE and ROE are starting points for fundamental analysis, not standalone indicators for making investment decisions. A thorough assessment should also consider the company's business model, competitive position, financial statements, industry conditions, management quality, valuation, and associated risks.
Understanding these ratios can help investors ask better questions when Investing in Stocks and evaluating the financial strength and efficiency of a business.
NiveshArtha focuses on research-based market insights and fundamental and technical analysis to help investors understand businesses and market developments more effectively.
Niveshartha
September 5, 2026
Get in touch with us
Start investing today, for a better tomorrow
If you’d like to talk to our executive kindly call us on +91 8884014014 during 9 am - 5 pm weekdays.
Start investing today, for a better tomorrow
If you’d like to talk to our executive kindly call us on +91 8884014014 during 9 am - 5 pm weekdays.





*Disclaimer: “Registration granted by SEBI, Enlistment as RA with Exchange and certification from NISM in no way guarantee performance of the intermediary or provide any assurance of returns to investors.”
*Disclaimer: For security/securities displayed in the website and in the advertisement - “The securities quoted (If any) on our website or in any of our advertisement are for illustration only and are not recommendatory.”
*Standard warning: “Investment in securities market are subject to market risks. Read all the related documents carefully before investing.”
*Mandatory notice: “Clients shall be requested to go through Do’s and Don’ts while dealing with RA as specified in SEBI master circular no. SEBI/HO/MIRSD-POD- 1/P/CIR/2024/49 dated May 21, 2024 or as may be specified by SEBI from time to time.”
Note: We have changed our pricing with effective from 01/12/2024.
Niveshartha ©2026 All Rights Reserved.
Developed by Techisor